Compliance
The Compliance section displays the patient’s compliance status and usage trends. Use this section to:
monitor progress toward CMS compliance
identify patients at risk of non-compliance
prioritize follow-up.
Compliance follows the CMS definition. For more information see, Add PAP machines.
Orion calculates compliance using the PAP machine marked as the compliance machine.
By default, the first PAP machine added to the patient profile is the compliance machine. If multiple PAP machines are assigned, Orion uses the machine with the Calculate compliance/reimbursement using this machine check box selected.
The Compliance overview panel summarizes current compliance performance.
Compliance forecast: The score predicts the probability that a patient on a specific therapy day may meet the CMS definition of compliance. Click Explain forecast to view key factors that affect the compliance forecast in greater detail.
% of compliant days ≥ 4 hours in the last 30 days: The percentage of the last 30 days in which the patient used therapy for at least 4 hours.
Days since setup: The patient's total number of days on therapy since their initial compliance period start date.
Days left in the first 90 days of therapy: The total number of days that remain for the patient to reach the CMS definition of compliance.
Use Compliance outlook to review projected compliance scenarios.
Days missed: The number of future compliant days the patient could miss (per the CMS rules).
Days to compliance: The number of additional compliant days needed to meet CMS requirements. The projected compliance date assumes the patient uses the PAP machine for at least 4 hours each day.
The calendar view displays the projected compliance window. You can click the rows in the section on the left to view projected 30-day compliance window scenarios. As the 30-day compliance window moves, the total number of days needed to achieve compliance increases if the patient does not use their PAP machine.
The Usage chart shows a patient's daily PAP machine usage since their initial compliance period start date. The chart shows days with:
4 or more hours of PAP machine use
less than 4 hours of PAP machine use
no usage
no data received from the patient's PAP machine.
Hover over a day to view detailed usage information.
The Initial compliance journey chart shows the patient’s last 30-day compliance percent plotted over their 90-day journey. The chart also displays each time a clinical user reviewed the patient, or contacted them by phone, voicemail or email. Projected results differ from actual outcomes.
Note
Orion provides predictive insights only. Clinicians are responsible for verifying compliance before billing or clinical decisions.
Orion uses a proprietary 90-day machine learning model to predict how likely a patient is to meet CMS compliance. The model considers a patient compliant when they use their PAP machine for at least four hours a day for 21 out of 30 days during their first 90 therapy days.
The model calculates a prediction for eligible patients on each therapy day.[1]
Orion provides supporting compliance data to help HMEs review patient lists and prioritize outreach.
Orion uses data from a Resmed database in the United States to train and test the model and make predictions. The system uses a de-identified copy of the data and removes all protected health information (PHI) to create an anonymous patient population. The data includes patients in their first 90 days of therapy who use non-ventilation PAP machines.
The model analyzes the machine usage data to create the following inputs:
Machine usage: Total hours the patient used the machine on a given day.
Average machine usage: Average usage over the last 3, 7, 14 and 28 days.
Number of compliant days: Number of days with at least 4 hours of usage over the last 10, 20 and 30 days.
Days since setup: Number of days since the patient's setup date.
Approximately 90% of patient gender data is not available. Patient ages range from 0-99, with most patients between 50 and 74 years old. Other demographic data, such as ethnicity or health conditions, is not included in the model.
Note
Model performance does not vary by age or gender. For more information, see Model performance.
To provide accurate predictions, the data must meet the following requirements:
Completeness
The data cannot be missing more than 30% of values. This helps reduce incorrect predictions.
Accuracy
PAP machine usage values may sometimes exceed 24 hours. In these cases, the model limits the value to a range between 0 and 24 hours.
Timeliness
Data cannot be delayed by more than 24 hours. This ensures that predictions are current. If data is delayed by more than 48 hours, Orion displays the last available prediction.
Validity
PAP machine usage features must be floating-point values. The number of compliant days and days since setup must be whole numbers.
Each prediction is a probability between 0 and 1. This value shows how likely the patient is to meet compliance within 90 days. For example, a value of 0.8 means there is an 80% likelihood that the patient will become compliant.
Orion also provides Shapley Additive Explanation (SHAP) values. These values explain how each factor affects the prediction. Each factor is shown as:
Green: Positive impact on the forecast.
Red: Negative impact on the forecast.
The model ranks each factor based on how much it influences the final score. For more information, see Compliance forecast.
The model was developed using supervised learning to solve the classification problem of non-compliance (0) or compliance (1).
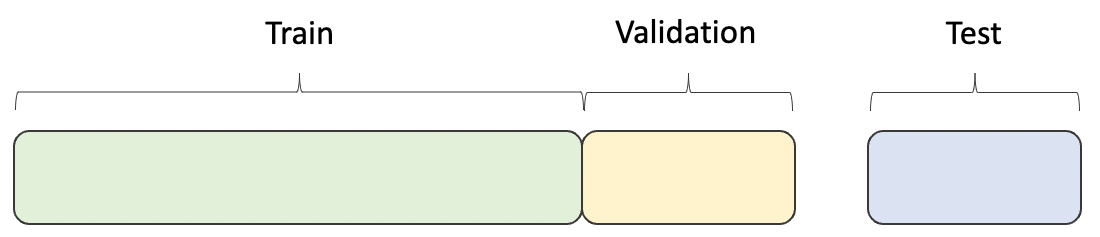
To perform supervised learning, Orion sources a dataset from production data to ensure there is no discrepancy between the data used for training and the data used to serve real predictions. The dataset is divided into three groups:
Train
Validation
Test
The model trains on a dataset that uses patient results with known compliance outcomes and “learns” to minimize errors between its predictions and known targets. Once trained, Orion uses the validation dataset to estimate how well the model can generalize and predict when it uses new data. In addition, the validation dataset optimizes certain model parameters to improve performance. Orion evaluates the model on a test dataset (unseen data) to verify how well it will perform in the real world and deploys the model after it can accurately predict results when it analyzes new data.
Orion uses a gradient-boosted decision tree algorithm. This algorithm makes a series of small decisions that inform and refine the final prediction.
Resmed measures model performance using several metrics:
Accuracy: The percentage of patients the model correctly predicted compliance for.
False positives: The percentage of patients predicted to be compliant but are not.
False negatives: The percentage of patients predicted to be non-compliant but become compliant.
Area under the curve (AUC): The measure of the accuracy of machine-learning models. The higher the AUC score, the better the model is performing. A classifier that randomly picks a patient to be non-compliant or compliant would have an AUC of 0.5, while a classifier that makes accurate predictions would have an AUC of 1.0.
Brier score: The measure of the accuracy of probabilities. When applied to any machine-learning model, the lower a model’s Brier score, the more accurate its predictions.
We analyze these metrics to improve the accuracy of our model.[1]
As Orion only provides probabilities, the Brier score is the most important metric since it measures the accuracy of probabilities. The following table displays comparable model performance on the validation dataset and the test dataset, which suggests that the model makes helpful predictions using new patient data. In addition to the evaluations in the table, Resmed monitors the model's performance to ensure we achieve the intended outcomes.
Metric | Validation dataset | Test dataset |
|---|---|---|
Accuracy | 86.93% | 86.85% |
False positives | 6.06% | 6.12% |
False negatives | 7.01% | 7.03% |
AUC: [0,1] | 0.9463 | 0.9458 |
Brier score: [0,1] | 0.092 | 0.093 |
Through validation and testing, Resmed noted no significant changes in model performance across age, gender or HME. Demographic-related information, such as ethnicity and disease or condition, are not available in our dataset that is used to train and evaluate the model.
Important
Model performance varies by days since setup. The model performs best toward the end of the 90-day compliance window. Our dataset highlights that patients who reach compliance will most often achieve compliance early.
Model limitations
The model is not 100% accurate. It may sometimes:
predict a compliance forecast lower than expected
predict a compliance forecast higher than expected.
However, the high accuracy (high AUC [0.9463] and low Brier score [0.092]) demonstrates that the model generally performs well and provides a useful tool to support patient outreach.
[1] Any prediction is subject to multiple factors and there is no guarantee that any patient will reach compliance on any particular date or under every circumstance.